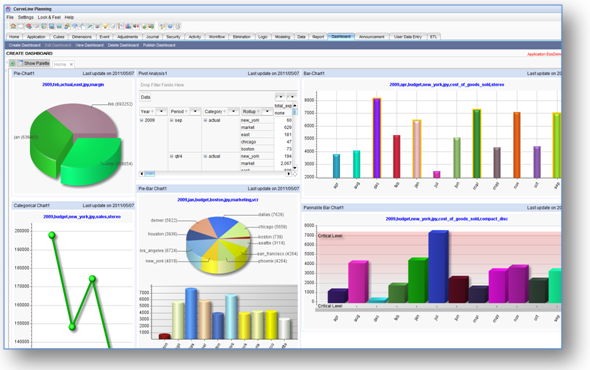
Dashboard and Reporting
Most dashboards used by executives are visually simple to understand, yet they display powerful
information about a particular area of the company. A financial dashboard is a powerful reporting tool that
enables one to have a quick look at the company's profitability information. This type of dashboard enables
the management to stay on top of their finances without the need of throwing an arm and a leg. Since the financial
performance of a company cannot be judged in a timely manner based on financial statements, financial dashboards
act as a more up-to-date option. Basically, it provides a great visual overview of any company's health.
Financial dashboard reports ensure that the financial vitals of the company are readily available to the management.
It facilitates in the speedy decision making process, thereby making it a priceless tool. The huge compilation of
the financial data integrated at one place in a strategic manner helps business executives know the financial
standing of a company at any given point of time. This ensures that the management is able to spot financial
discrepancies very easily. Consequently, the management can take corrective steps to deal with the error in a
timely manner. Those companies that make use of a corporate dashboard encounter less financial hurdles due to
human or software error. The present metrics that measure results will help one come up with a proper course
of action and plans for improvement over any financial hurdle faced by a company. It also improves data
transparency, which is a must in todayüfs business environment. To top it all, it enables one to avoid
full-fledged financial scandals.
* Flexibility
Many managers have a simple philosophy of management reporting: "I want what I want when I want it." One reason
for the popularity of Excel is that it gives users the ability to adapt quickly to managers' changing requirements.
This flexibility applies to dashboards as well. Using Excel, you can replace one chart with another, add a new
column of data, change a color, add a second page, or use a bigger font.
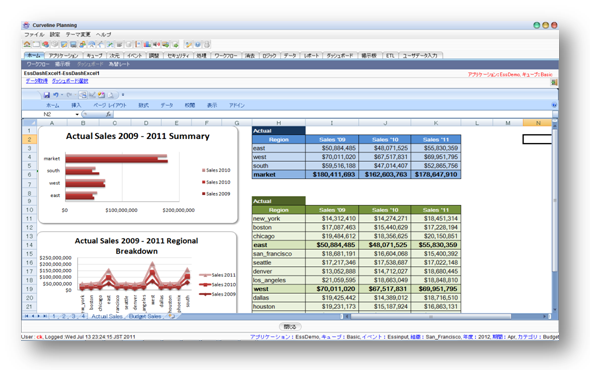
* Analytical power
Excel reports often present complex ratios, statistical calculations, and other sophisticated results that could
be displayed very effectively in a dashboard.
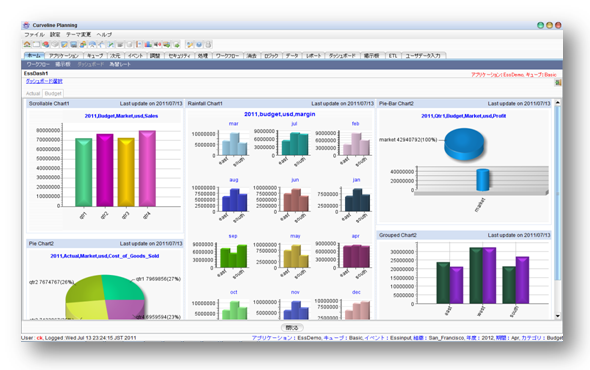
Curveline dashboard features:
. Interactive
. Tabbed panes
. Drag and drop
. Built-in palette to list all available gadgets
. Built-in persistence of the layout of all dashboards and widget settings
. Infinite drill-down and roll-over capabilities
Click for price details
Click to contact for more details
Click for brochure
|